
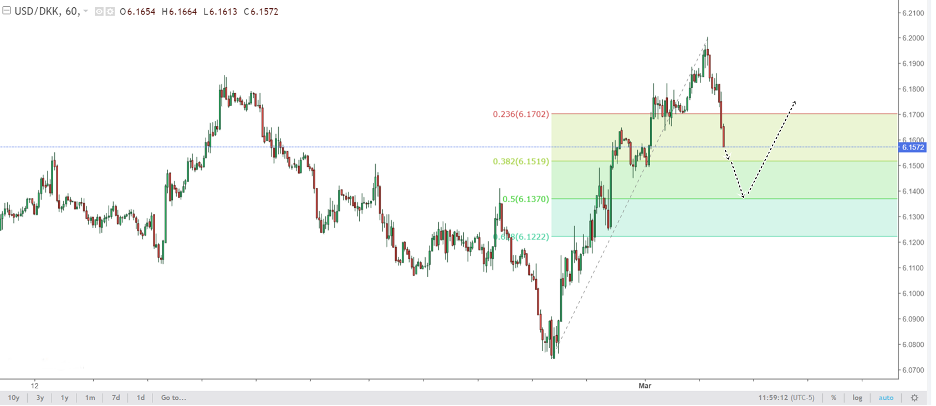
The USDDKK pair started its extended bullish rally and secured a new high at 6.2001. From that level, the bulls have started to show some signs of exhaustion which is a clear indication that the pair wants to start is the bearish correction. USDDKK has already breached the minor support level at 6.1701 which is also the 23.6% Fibonacci retracement level drawn from the low of 25 February to the high of 2nd march, 2020. Though the Fibonacci retracement level has been drawn in the 1-hour chart, the current momentum in the USDDKK pair strongly suggests the retracement is going to be a bit deeper.
Fibonacci analysis
As we have a broken 23.6% Fibonacci retracement level in the 1 hour, the support at 6.1701 is now going to act as a strong resistance. The pair is most likely to test the critical support level at 6.1515 which is also the 38.2 Fibonacci retracement level. But this level is most likely to be breached as it is backed by a weak cluster of support. A break of the 38.2% Fibonacci retracement level might push the pair towards the 50% Fibonacci retracement level at 6.1373. This level is going to act as a strong support level for the USDDKK pair and any bullish price action signal will be an excellent opportunity to execute the long forex trade.
Figure: USDDKK 1 hour chart analysis
If the bears manage to push below the 50% retracement level, we might see a test of the 61.8% retracement level. This level is going to be critical for the trend traders since a break below the 61.8% retracement level will confirm the end of the current bullish rally. The USDDKK pair will again start making new higher lows in the market in favor of the long-term bearish trend. So, if the critical support at 6.1225 gets broken, look for selling opportunity only. As long as those support levels hold, any bullish price action signal will be an excellent opportunity to take the long trade.
Daily chart analysis
In the daily chart, the overall bias for the USDDKK pair remains slightly bearish. But we have noticed the price is trading within a range extending from 6.1068-6.2250 in the daily chart. Currently, the price has started its bearish move after testing the resistance zone 6.2250. The bearish momentum in the market is most likely a part of the bearish correction in the price. So any, bullish price action confirmation signal at the 6.1068 level will confirm the end of bearish correction for the USDDKK pair.
On the contrary, the USD pair manages to break above the 6.2250 level, we can look for a strong buying signal to execute the long trade. But buying the asset right at the break of the 6.2250 level will be an immature act as the long-term trend is still bearish. We need to see strong bullish at the 6.2250 level after it turns into a support level.
Guidelines for trades
By analyzing the daily and the 1-hour chart, it is pretty clear the pair is in the bearish correction mode. So, if you intend to take the short trade considering the long-term trend is bearish, you might be making a big mistake. You have noted that the USDDKK pair has already established a new high in the market and the fundamental factors for the U.S dollar index are also showing promising strength for the bulls. So, it better not to anticipate any short trade favoring the long-term bearish trend.
The price of the USDDKK pair is trading in a neutral zone. The pair needs to test a valid support level and form a bullish price action signal before we can take the long trade. And a test of the critical support with the formation of the bullish price action signal will also confirm the end of bearish correction. So, it is better to wait till we get a favorable buying opportunity at the major support level.